London Borough of
Newham
Newham is an outer London borough. 2.00% of the borough's 3,620.80 hectare (13.98 square mile) area is greenbelt. Furthermore, 5.50% of the borough is Metropolitan Open Land.
The borough has 7 conservation areas, with a total area of around 64.31 hectares. That's around 1.78% of the borough's total area.
The council is currently under Labour control and in 2018 had an approximate population of 352,010.
Newham's most recent Local Plan was adopted on 10 December 2018.
London Borough of Newham has a Design Review Panel, which it administers itself. There's more information here.
Facts & Figures
18
2.00%
Green Belt as Percentage of Total Area
Total area of designated green belt within borough boundary, expressed as percentage
19
3,621
Total area (ha)
Total area of borough, in hectares
10
97
Population density
People per hectare (based on 2018 population data), including green belt and metropolitan open land
12
105
Population Density (excluding green space)
People per hectare (based on 2018 population data), excluding green belt and metropolitan open land.
14
36.19
Housing Density
Homes per hectare, excluding greenbelt and Metropolitan Open Land (MOL), 2020 estimate
6
10.62%
Population Increase, 2013 - 2018
Percentage change in population in five-year period between 2013 and 2018
33
21,270
Mean Household Income
Estimated household income, mean
31
5.45%
Household Income / House Price Ratio
Ratio of average (mean) annual income, 2018 estimate, to average (median) house price, 2017 estimate
1
17.90%
Overcrowding
Percentage of overcrowded homes in borough.
3
352,010
Population, 2018
Total population, 2018 figures
1
2.90
Occupancy Level per Dwelling
Approximate number of persons per dwelling, based on total borough population (based on 2018 levels) divided by total number of dwellings (based on 2020 projections).
Planning Statistics
30
4
Major Residential Applications Decided, 2020
Total number of "major" planning applications for residential dwellings decided by LPA during 2020
28
4
Major Residential Applications Granted, 2020
Total number of "major" planning applications for residential dwellings granted by LPA during 2020
30
4
Major Residential Applications Decided in Time, 2020
Total number of "major" planning applications for residential dwellings decided within required timescale by LPA during 2020
16
241
Residential Planning Applications, 2019 - 2020
Number of residential planning applications (not number of dwellings) considered by planning authority in period 2019-20.
Note that this figure is the total number of planning applications considered rather than the number of homes proposed as part of those applications.
1
100.00%
Percentage of Major Residential Applications Decided in Time, 2020
Percentage of "major" planning applications for residential dwellings determined in time by LPA during 2020
26
162
Residential Planning Applications, 2018 - 2019
Number of residential planning applications (not number of dwellings) considered by planning authority in period 2018-19.
Note that this figure is the total number of planning applications considered rather than the number of homes proposed as part of those applications.
1
48.77%
Change in number of residential planning application, 2019 to 2020.
Percentage change in number of residential planning applications between years 2019 and 2020.
Note that this figure is the total number of planning applications considered rather than the number of homes proposed as part of those applications.
1
100.00%
Percentage of Major Applications Granted, 2020
Percentage of "major" planning applications for residential dwellings granted by LPA during 2020
Planning Constraints
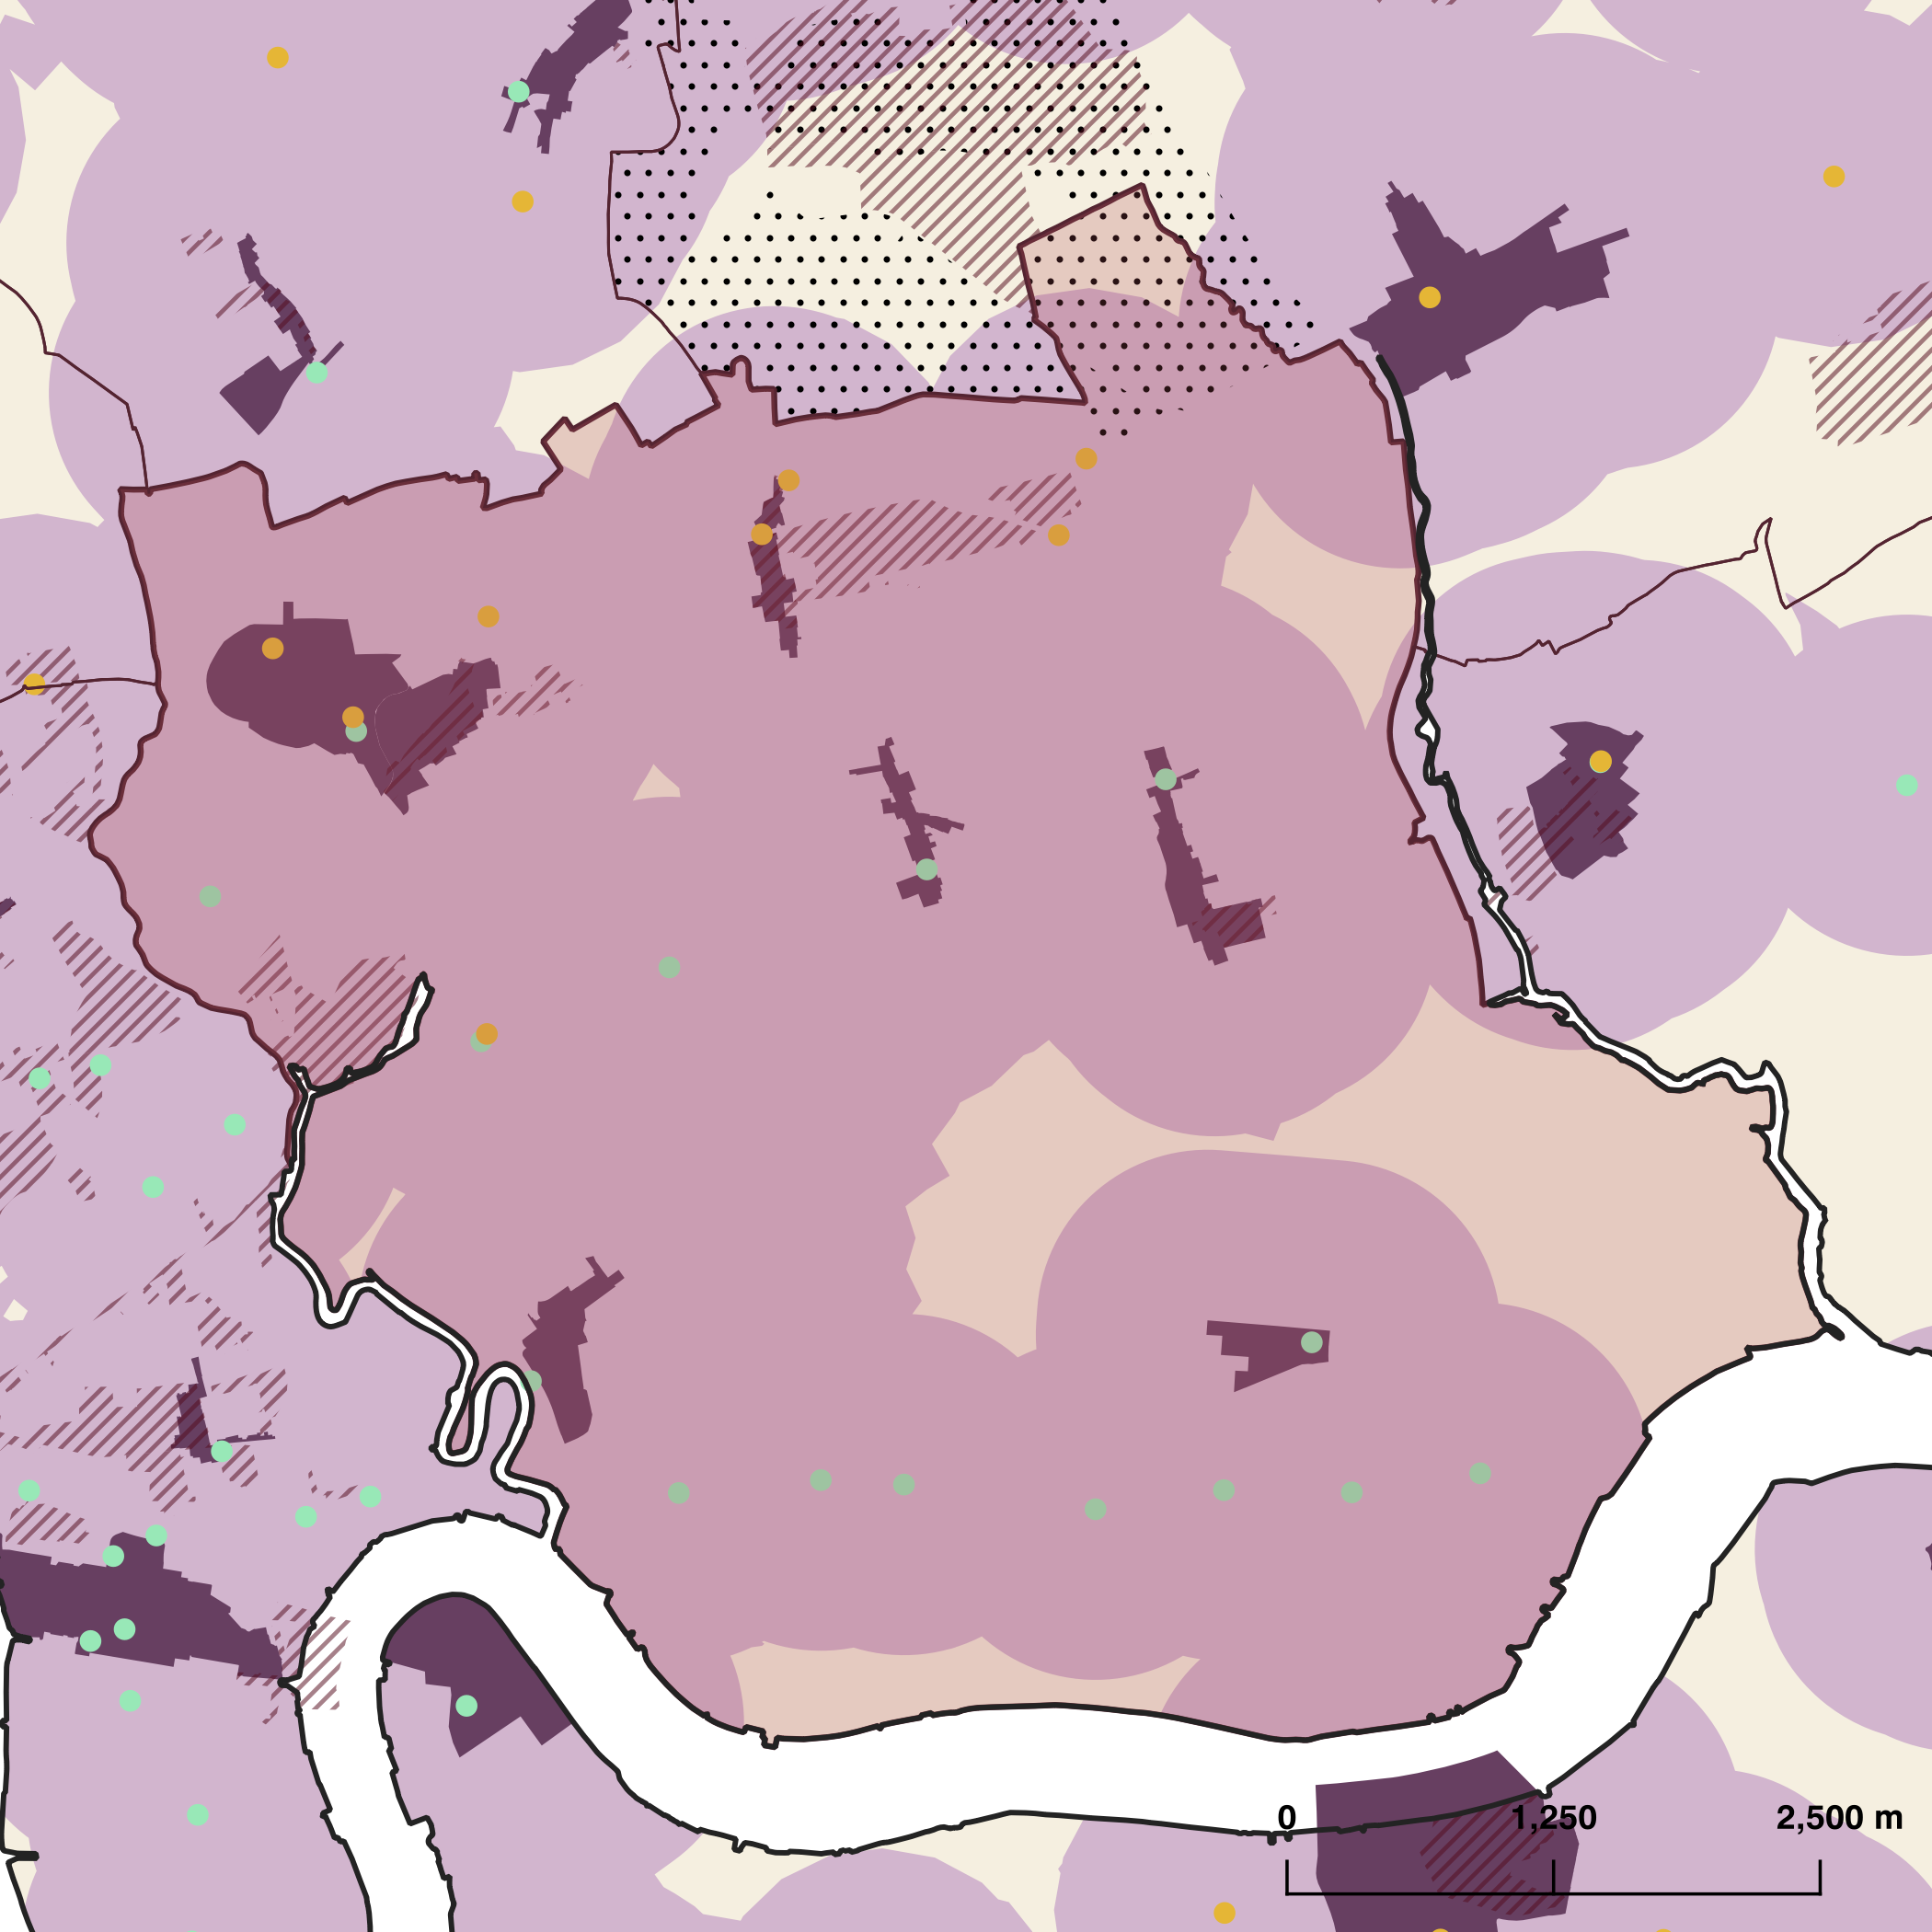
London Plan Small Sites Policy H2
Town Centre Boundaries
Green Belt
Conservation Area
TfL Station
Other Station
Green Belt & Open Land
For more information about green belt in London Borough of Newham, click here.
17
77.51
Area of green belt
Total area of greenbelt, in hectares
23
199.14
Area of Metropolitan Open Land (MOL)
Total area, in hectares, of metropolitan open land
29
7.50%
Green belt and MOL
Percentage of total area which is either green belt or Metropolitan Open Land (MOL)
14
3,344
Area of Borough, Less Green Belt and MOL
Total area of the borough which is not either green belt of Metropolitan Open Land, in hectares.
26
277
Total Area of Protected Open Land
Total area of borough designated as either Green Belt or Metropolitan Open Land
Highways
16
466.73
Total Surface Area of Roads
The total area taken up by roads (public highway, excluding pavements), expressed in hectares.
13
12.89%
Surface Area of Roads
Percentage of borough's total area occupied by public highway, assuming an average road width of 9m for local roads, and 12m for regional and national roads.
9
66.50
Area (sqm) per Registered Car
Using DFT data from 2018, the total area in square metres of roads for each private registered car (excluding vans)
London Plan Targets
Newham, London Borough of's 10 year housing target in the currently adopted 2015 London Plan was 19,945. This was increased to to 38,500 in the 2018 draft replacement ("Examination in Public") version of the London Plan.
In the adopted version of the new London Plan, this target has been revised to 32,800; a reduction of 14.81%.
5
19,945
10-Year Housing Target, 2015 Superseded London Plan
10 year housing target
1
38,500
10-Year Housing Target, 2018 Draft London Plan
10 year housing target
2
32,800
10-Year Housing Target, 2021 Current London Plan
10 year housing target. (Table 4.1 in the "Publication London Plan December 2020" version)
4
9.06
10-Year Housing Target Per Hectare, 2021 Current London Plan
10 year housing target per hectare
4
8.75
10-Year Housing Target Per Hectare (Less Protected Open Space), 2021 Current London Plan
10 year housing target per hectare (excluding greenbelt and Metropolitan Open Land)
4
0.09
10-Year Housing Target Per Hectare (Per Head of Population), 2021 Current London Plan
10 year housing target per head of population (2018)
22
14.81%
Reduction in total housing targets
Comparison between ITP and EIP targets (percentage change)
14
93.03%
Change in housing targets, 2015 London Plan to 2018 Examination in Public London Plan
26
-5,700
Total Change in Housing Targets
Difference between 2018 'Examination in Public' version of the London Plan and the 2019 'Publication London Plan December 2020' version.
Small Sites
In the 2018 draft replacement London Plan, Newham's housing target for small sites (below 0.25Ha) was 9,500—24.68% of its total requirement. In the adopted version of the plan this has been changed to 3,800 which is a reduction of 60.00%.
For more information on small sites in London Borough of Newham, please click here.
8
9,500
10-Year Small Sites Housing Target, 2018 Draft London Plan
10 year small sites housing target
12
3,800
10-Year Small Sites Housing Target, 2021 Current London Plan
10 year small sites housing target. (Table 4.2 in the "Publication London Plan December 2020" version)
31
11.59%
Percentage of Homes on Small Sites, 2021 Current London Plan
Percentage of homes to be delivered on small sites
15
60.00%
Reduction in Small Sites targets
Comparison between ITP and EIP targets
24
-5,700
Reduction in Small Sites Targets
Total reduction in quantity of homes to be delivered on small sites between EIP and ITP versions of the plan
14
86.56%
Percentage of borough included within policy H2
Percentage of total borough area which is included within new London Plan (Publication London Plan December 2020) Policy H2, paragraph 4.2.5 zone, ie. within 800m of a station or town centre, or PTAL 3 or more.
14
1.21
Density of homes to be delivered within London Plan Small Sites zones
Density of homes per hectare, limited to area included within new London Plan (Publication London Plan December 2020) Policy H2, paragraph 4.2.5 zone, ie. within 800m of a station or town centre, or PTAL 3 or more.
6
3.03
Density based on 2018 London Plan small sites targets
Homes / hectare, including areas of borough only covered by Policy H2, paragraph 4.2.5, ie. PTAL 3+ or within 800m of station or town centre.
5
1.82
Additional homes per hectare required to achieve London Plan 2018 targets compared to 2019 targets
Based on London Plan targets, and small sites zones as defined by Policy H2, paragraph 4.2.5 zone, ie. within 800m of a station or town centre, or PTAL 3 or more.
12
3,134
Area of borough included within Policy H2, paragraph 4.2.5 zone
Policy H2 of the Publication London Plan December 2020 defines areas appropriate for small site development (ie. 0.25ha or less) as having a PTAL of 3 or higher, or within 800m of a station or a town centre boundary.
16
59,432
Freehold Titles <0.25ha
Total number of freehold titles within borough which have an area less than 0.25ha
21
0.49
Ratio of Small Sites to Total Housing Stock
Total number of freeholds with an area of less than 0.25ha divided by total number of dwellings (housing stock)
3
0.96
Ratio of Small Sites to All Sites
Total number of freehold sites with an area of less than 0.25ha divided by the total number of freehold sites for that borough
17
49.35
Area of Green Belt within Small Sites Policy H2 Zone
The total area, in hectares, of land which is both designated green belt and within the London Plan small sites policy H2 zone, ie. within 800m of a station, town centre, or with PTAL 3 or greater
18
4,374
Historic Small Sites Housing Approvals (2010-2019)
Total net number of residential dwellings approved on small sites (<0.25ha) during period 2010-2019, based on date of approval. Note that these figures include duplicate applications for the same site.
13
548
Historic Small Sites Affordable Housing Approved (2010-2019)
Total net number of affordable residential dwellings approved on small sites (<0.25ha) during period 2010-2019, based on date of approval. Note that these figures include duplicate applications for the same site.
2
68.15%
Percentage of Green Belt within H2 Zone
Percentage of total green belt area which also falls within the London Plan Small Site Policy H2 zone (ie. 800m from station, town centre or with PTAL 3 or more)
16
12.53%
Affordable Dwellings as Percentage of Small Site Approvals (2010-2019)
Percentage of planning approvals for new dwellings on small sites (<0.25ha) defined as "affordable" during period 2010-2019 inclusive. Note that there may be duplicate applications for the same site on different dates.
11
0.87
Ratio of Small Sites Approvals to Publication London Plan December 2020 Small Sites Targets
Total small sites housing target in Publication London Plan December 2020 divided by the total number of approved dwellings on small sites (<0.25ha) during period 2010-2019 inclusive. Note that there may be duplicate applications for the same site on different dates.
17
1.21
Number of Dwelling Approved on Small Sites per Hectare
Total number of dwellings approved on small sites (<0.25ha), per hectare, for period 2010-2019 inclusive. Note that there may be duplicate applications for the same site on different dates.
19
1,070
Total Number of Planning Applications for Small Sites, 2010-2019
The total number of planning applications approved for small sites (<0.25ha) which include a net increase in residential dwellings. (Note that this the number of applications, not the number of homes approved within those applications).
12
66
Total Number of Planning Applications for Affordable Housing on Small Sites, 2010-2019
The total number of planning applications approved for small sites (<0.25ha) which include a net increase in affordable residential dwellings. (Note that this the number of applications, not the number of homes approved within those applications).
16
1.57%
Percentage of Policy H2 Zone within Green Belt
The percentage of the borough which falls within the London Plan Policy H2 small sites zone which also falls within green belt designation.
17
2,879
Total Completed Small Sites Housing Developments 2010-2019
Total number of homes on small sites (<0.25ha) consented within period 2010-2019 inclusive, which have also been shown as completed within the London Development Database.
14
357
Total Completed Small Sites Affordable Housing Developments 2010-2019
Total number of affordable homes within small sites (<0.25ha) consented within period 2010-2019 inclusive, which have also been shown as completed within the London Development Database.
20
65.82%
Percentage of Completed Homes on Small Sites Consented 2010-2019
The percentage of homes on small sites (<0.25ha) which have been completed compared to those consented in the period 2010-2019, according to the London Development Database. Note that the total number of consented homes might include multiple approvals for the same site: the completed schemes, presumably, do not. Note also the likely under-reporting of this figure, as applications consented within recent years may not have been completed and therefore would not be included within these figures.
24
0.76
Ratio of Historic Housing Completions on Small Sites Compared to Publication London Plan December 2020 Housing Target
This figure shows the total number of completed small sites housing units which have been consented in the ten-year period 2010-2019 divided by the new London Plan (Publication London Plan December 2020) small sites housing target (Policy H2). Those boroughs which exceed 1.0 have delivered more homes on small sites the last 10 years than they are required to do under the new targets.
16
0.80
Density of Completed Small Sites (Dwellings/Hectare) Consented 2010-2019
Density of homes completed on small sites in the ten-year period 2010-2019, expressed as dwellings per hectare.
Housing Delivery Test
Newham's required number of new homes between 2018 and 2022 was 7,103. In this period it actually delivered 5,934 new homes, resulting in a Housing Delivery Test measurement of 84%.
Newham will now need to revisit its local plan to identify a 20% 'buffer' of additional land within its five-year housing pipeline.
2022 Results
None
Action Plan
Buffer
Presumption in Favour of Sustainable Development
2021 Results
None
Action Plan
Buffer
Presumption in Favour of Sustainable Development
2020 Results
None
Action Plan
Buffer
Presumption in Favour of Sustainable Development
2019 Results
None
Action Plan
Buffer
Presumption in Favour of Sustainable Development
2018 Results
None
Action Plan
Buffer
Presumption in Favour of Sustainable Development
Note that the above maps exclude both Mayoral Development Corporations for clarity. See the ranking tables below for the performance of these entities.
12
114.00%
NPPF Housing Delivery Test 2021: Score
Percentage of homes delivered compared to number required, for period 2018-21 inclusive, as described by NPPF Housing Delivery Test (note that the 'consequence' of the result is based on a figure rounded to the nearest whole number, so a score of, say, 94.7% will result in no consequence. For the purposes of this table, figures have been rounded accordingly, even though they are expressed to two decimal places.)
2
7,103
NPPF Housing Delivery Test 2021: Number Required
Total number of new homes required in period 2018-2021, as defined by the government's 2021 Housing Delivery Test measurements
11
16.40%
Change in Housing Delivery Test Results 2020 to 2021
Percentage change in results between 2020 - 2021
2
8,080
NPPF Housing Delivery Test 2021: Number Achieved
Total number of new homes achieved in period 2018-2021, as defined by the government's 2021 Housing Delivery Test measurements
12
114
NPPF Housing Delivery Test 2021: Score
Percentage of homes delivered compared to target
19
216.55%
Comparison of 2021 Housing Delivery Test (required) / London Plan Housing Targets (Publication London Plan March 2021)
Percentage of homes required to be delivered under the 2020 Housing Delivery Test (six year period, from 2018-2021 inclusive) compared to the Publication London Plan March 2020 version of the London Plan (annualised figures for four year period).
Housing Targets - Standard Method
2
3,616
Standard Method - Total Housing Targets
Total number of homes to be delivered using current standard method, according to planning consultancy Lichfields
8
3,644
2020 Standard Method - Total Housing Targets
Total number of homes to be delivered using 2020 standard method, according to planning consultancy Lichfields
31
100.77%
Standard Method - Change in Total Housing Targets
Change in housing targets based on comparison between current Standard Method and 2020 version, according to Lichfields
13
1.09
Standard Method 2020 - Density
Density of homes to be provided under proposed 2020 Standard Method, per hectare, excluding green belt and metropolitan open land
8
3.01%
Standard Method 2020 - Percentage of Total Housing Stock
Total housing target for borough using proposed 2020 Standard Method, expressed as a percentage of total housing stock (2020 projections)
Planning Policy
4
10 December 2018
Local Plan - Date of Adoption
Date of current (or at least, most recent) Local Plan adoption, based on Planning Inspectorate information. See source for date
30
67
Months since Local Plan adoption
Number of months that have elapsed since the LPA's Local Plan was adopted
Planning Appeals
29
47
Planning Appeals Decided - 2018-2019
Total number of planning appeals decided between April 2018 and March 2019
32
3
Planning Appeals Allowed - 2018-2019
Total number of planning appeals allowed between April 2018 and March 2019
33
6.38%
Percentage of Planning Appeals Allowed
Percentage of planning appeals allowed in period April 2018 to March 2019
House Prices
32
£56,000
Median House Price, end of December 1997
Median cost of market-sale housing, excluding sales below market value (eg. Right to Buy), sales below £1,000 and sales above £20m
28
£390,500
Median House Price, end of December 2017
Median cost of market-sale housing, excluding sales below market value (eg. Right to Buy), sales below £1,000 and sales above £20m
2
697.32%
10 Year House Price Increase
Percentage increase in median house price between December 1997 and December 2017
33
290.62%
Ratio of house prices to median earnings, 1997
Ratio of house prices to median earnings, based on 1997 data
26
1,269.09%
Ratio of house prices to median earnings, 2017
Ratio of house prices to median earnings, based on 2017 data
31
22.90%
Change in house price to median earnings ratio, 20 year period
Percentage change in house price / median earning ratio in 20 year period from 1997 to 2017
Housing Stock
13
121,204
Housing Stock (2020)
2020 projected total housing stock
1
41.98%
Housing Stock (Increase, 2020-2030)
Projected increase in housing stock 2020 - 2030
15
49.70%
Flats as percentage of total dwellings
Number of flats within each borough expressed as a percentage of total housing stock, based on VOA data
16
21.56%
Percentage of 1 bed homes
Percentage of total number of dwellings which have one bedroom (including houses and flats)
14
107,690
Total number of dwellings
Total number of dwellings within borough, based on VOA data
19
44,050
Number of Family Homes
Total number of family homes (dwellings with 3 or more bedrooms) based on 2015 data.
10
31.07%
Percentage of 2 bed homes
Percentage of total number of dwellings which have two bedrooms (including houses and flats)
16
52.63%
Percentage of 1 or 2 bed homes
Percentage of total number of dwellings which have one or two bedrooms (including houses and flats)
20
373,427
Total number of habitable rooms
Total number of habitable rooms for all residential property types, assuming the following: 1 bed = 2 habitable rooms, 2 bed = 3 habitable rooms, 3 bed = 5 habitable rooms, 4+ bed = 6 habitable rooms
18
111.50
Density of Habitable Rooms
Habitable rooms per hectare for all property types, assuming the following: 1 bed = 2 habitable rooms, 2 bed = 3 habitable rooms, 3 bed = 5 habitable rooms, 4+ bed = 6 habitable rooms, excluding green belt and metropolitan open land
13
0
Council homes completed, 2018
Total number of council homes built during 12 month period covering 2017/18
4
146
Council homes sold under Right to Buy, 2018
Total number of council homes sold under Right to Buy during 12 month period covering 2017/18
26
-146
Net number of Council homes
This formula deducts the total number of homes sold under Right to Buy from the number of council homes completed in the same period
28
13.15
Density of Family Homes
Number of family homes (assumed with three bedrooms or more) per hectare, excluding green belt and metropolitan open land
1
0.94
Residents per habitable room
This figure takes the 2018 population of the authority, divided by the total number of habitable rooms (based on 2015 housing stock data) to provide an approximate ratio of people per habitable room. The higher the figure, the more overcrowded the borough.
22
36.34%
Percentage of Housing Stock which is Family Homes
The total number of family homes expressed as a percentage of total housing stock.
Rents
15
£1,400
Median Monthly Rental, 2019
12 months to Q1 2019
1
60.73%
Increase in Median Monthly Rental, 2011 - 2019
Percentage change in median monthly rents, all categories, for period between 12 months to Q2 2011 to 12 months to Q1 2019.
Vacant Dwellings
16
1,893
Number of Vacant Dwellings
Total number of vacant dwellings, based on 2018 data
21
1.56%
Vacant Dwellings as Proportion of Housing Stock
Percentage of total housing stock (2020 estimate) which is defined as "vacant" by MHCLG methodology, based on 2018 figures
Brownfield Land
30
9
Area of Brownfield Land
Total area of brownfield land, in hectares, based on CPRE data
31
332
Projected Homes on Brownfield Land
Area of brownfield land multiplied by average borough housing density (based on 2020 housing projections), excluding green belt and metropolitan land. Note that this figure provides the potential additional dwellings based on existing densities rather than projected increases in density
32
0.86%
Comparison Against London Plan EIP Housing Targets
Compares the potential development capacity on brownfield land against the London Plan (Examination in Public) housing targets. Note that a comparison against small sites targets is not useful as the brownfield registers might include large sites which exceed 0.25Ha and therefore do not count as "small sites" under the Policy H2 definition
24
98.60%
Percentage of new homes consented on brownfield land
For period 2016/17
Golf Courses
24
2.87
Area of Golf Courses in Borough
Total area, in hectares, of all golf courses within the borough. Where a single golf course crosses a borough boundary, only the area that falls within it is counted
24
0.08%
Percentage of Borough Occupied by Golf Courses
Total percentage of borough area which is occupied by golf courses. Where a single golf course crosses a borough boundary, only the area that falls within it is counted
24
104
Potential Housing Capacity of Golf Courses
Taking the prevailing housing density for the borough, this shows the total potential capacity of the borough's golf courses have to provide housing. These areas include green belt, which would not be eligible for development, but as this is a slightly mischievous exercise it doesn't hurt to explore the idea
23
0.15
Area of Golf Courses not in Green Belt
Total area, in hectares, of golf courses which do no lie within designated green belt
23
5
Housing Capacity of Golf Courses not in Green Belt
The potential capacity for areas of golf courses which do not sit within designation green belt. There may be other protections (eg. Metropolitan Open Land) which apply, but which are not included within the data. For this data existing housing density has been calculated by excluding green belt land, but not MOL, as most golf courses that do not occupy green belt are otherwise designated as MOL
Homelessness
1
14,456
People living in temporary accommodation
As of March 2019
3
79
People Sleeping Rough
As of Autumn 2018
1
14,535
Total Number of Homeless People
2
4.13%
Percentage of Population Homeless
Estimate based on December 2019 figures (temporary accommodation) and Autumn 2018 estimate (rough sleepers)
1
27,635
Households on council housing waiting list, 2019
Total number of households on council housing waiting list
15
5.72%
Change in number of households on waiting list, 2018-2019
Percentage channge in number of households on borough housing waiting list, between 2018 and 2019.
1
26,139
Households on council housing waiting list, 2018
Total number of households on council housing waiting list
1
24.63%
Percentage of Households on Waiting List
Percentage of total borough households on housing waiting list
Demographics
1
47.29%
Percentage of total borough population classified as Asian
Percentage of total borough population falling within Asian classification, according to ONS
2
68.38%
Percentage of Total Borough Population as BAME
Percentage of total borough population falling within BAME (including Asian, Black, Mixed / Other) according to ONS classifications
Car Ownership
20
70,186
Number of licensed vehicles (cars only), 2018
Total number of licensed vehicles, by borough, 2018
3
14.53%
Change in number of licensed vehicles (cars), 2004 - 2018
Percentage change in number of licensed vehicles (cars only), 2004 - 2018
26
0.20
Number of licensed cars per head of population, 2018
Number of licensed vehicles (cars only) in 2018, divided by total borough population for the same year
18
19.38
Vehicle density
Number of licensed vehicles (cars only) per hectare, 2018 figures
33
-5.80%
Change in Car Ownership by Head of Population
Percentage change in car ownership per head of population in period between 2013 and 2018.
9
60,754.56
Number of Registered Vehicles within Small Sites Zone
Number of vehicles within London Plan Policy H2 Small Sites zone, assuming even distribution across the borough's area (including green belt)
Air Quality
12
14.00
Air quality, Particulates
Population weighted average concentration of PM2.5 (µg / m3), calculated for males and females and 5 year age groups separately,weighted average
12
38.20
Air quality, NO2
Population weighted average concentration of NO2 (µg / m3), calculated for males and females and 5 year age groups separately, weighted average
Wards
There are 20 wards in the borough:
| Ward Name | ONS Ward Code | Area (ha) |
|---|---|---|
| Beckton | E05000475 | 625.2 |
| Boleyn | E05000476 | 91.7 |
| Canning Town North | E05000477 | 252.1 |
| Canning Town South | E05000478 | 180.9 |
| Custom House | E05000479 | 206.3 |
| East Ham Central | E05000480 | 103.2 |
| East Ham North | E05000481 | 90.5 |
| East Ham South | E05000482 | 180.9 |
| Forest Gate North | E05000483 | 124.8 |
| Forest Gate South | E05000484 | 119.1 |
| Green Street East | E05000485 | 74.6 |
| Green Street West | E05000486 | 80.3 |
| Little Ilford | E05000487 | 190.0 |
| Manor Park | E05000488 | 133.5 |
| Plaistow North | E05000489 | 98.4 |
| Plaistow South | E05000490 | 138.5 |
| Royal Docks | E05000491 | 473.1 |
| Stratford and New Town | E05000492 | 423.5 |
| Wall End | E05000493 | 137.7 |
| West Ham | E05000494 | 133.7 |
| Total | 3,857.8 | |